Schools
More MAP Data on U City School District
The following is data from the Missouri Assessment Program.

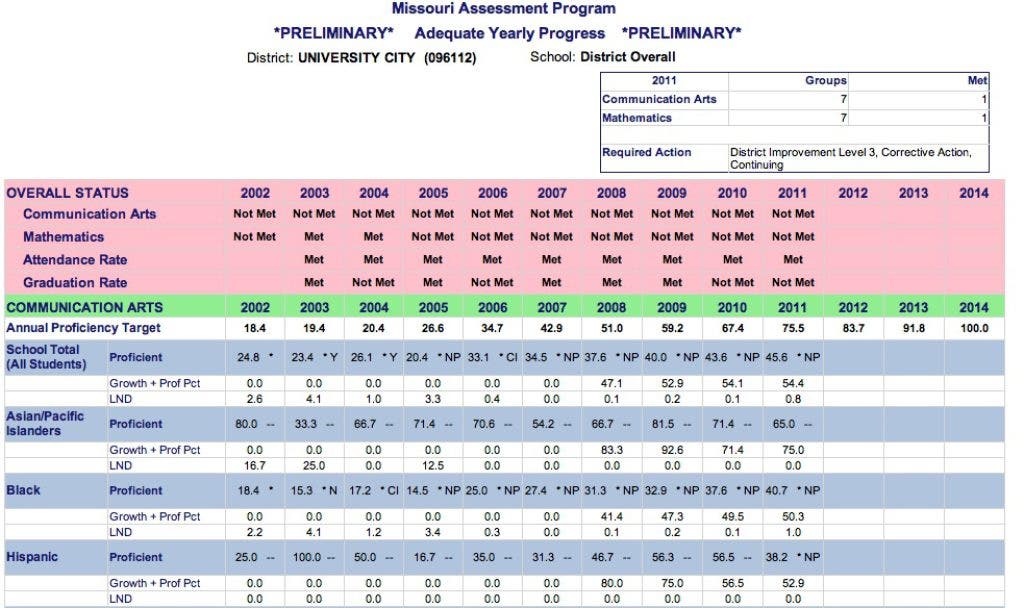
Missouri Assessment Program
*PRELIMINARY* Adequate Yearly Progress *PRELIMINARY*
District: UNIVERSITY CITY School: District Overall
Find out what's happening in University Citywith free, real-time updates from Patch.
OVERALL STATUS 2004 2005 2006 2007 2008 2009 2010 2011 Communication Arts Not Met Not Met Not Met Not Met Not Met Not Met Not Met Not Met Mathematics Met Not Met Not Met Not Met Not Met Not Met Not Met Not Met
Find out what's happening in University Citywith free, real-time updates from Patch.
2004 2005 2006 2007 2008 2009 2010 2011 Annual Proficiency Target 20.4 26.6 34.7 42.9 51.0 59.2 67.4 75.5
School Total (All Students) Proficient 26.1 * Y 20.4 * NP 33.1 * CI 34.5 * NP 37.6 * NP 40.0 * NP 43.6 * NP 45.6 * NP Growth + Prof Pct 0.0 0.0 0.0 0.0 47.1 52.9 54.1 54.4
2004 2005 2006 2007 2008 2009 2010 2011 Annual Performance Target 10.3 17.5 26.6 35.8 45.0 54.1 63.3 72.5
School Total (All Students) Proficient 17.8 * Y 19.9 * Y 31.1 * Y 32.7 * NP 35.2 * NP 35.0 * NP 40.9 * NP 39.0 * NP Growth + Prof Pct 0.0 0.0 0.0 0.0 43.9 45.4 50.3 47.6
ADDITIONAL INDICATOR -- ATTENDANCE RATE
2004 2005 2006 2007 2008 2009 2010 2011 School Total (All Students) 93.8 Met 94.0 Met 94.3 Met 94.2 Met 94.6 Met 94.4 Met 94.5 Met 94.6 Met ADDITIONAL INDICATOR -- GRADUATION RATE 2004 2005 2006 2007 2008 2009 2010 2011
School Total (All Students) 67.80 Not Met 71.80 Met 68.80 Not Met 76.70 Met 80.90 Met 83.80 Met 82.50 Not Met 83.80 Not Met
General Notes:
School level calculations do not include students who have been in the school less than a full academic year.
District level calculations do not include students who have been in the district less that a full academic year.
To meet AYP, all subgroups that met the minimum cell size requirements must have tested at least 95% of the students and met the Annual Proficiency Target and the additional indicator requirement.
Additional Indicator:
For both school and district reporting, Attendance Rate is used at the elementary and middle levels; at high school level, Graduation Rate is used. (Note: District level reporting is determined by the highest grade level. K-8 districts use Attendance Rate, K-12 districts use Graduation Rate and the K-8 Attendance Rate. The requirement for MET is: Attendance Rate is equal to or greater than 93% OR shows improvement from previous year; Graduation Rate equal to or greater than 85% or demonstrates improvement from the prior year. If Graduation Rate is 75.0% to 84.9%, improvement must be greater than 2%. If Graduation Rate is less than 74.9%, improvement must be greater than or equal to 5%.
Additional Indicator Symbols
Y - for Attendance Rate indicates that the group met the requirement based on improvement.
MY - for Graduation Rate indicates that group the met the requirement based on improvement
MYY - for Graduation Rate indicates that the group met the requirement based on improvement using the group of Total, indicating that the cell size was too small for that grour
MMY- for Graduation Rate indicates that the group was Not Met, indicating that the cell size was too small for that group and the group of Total was used in the determination.
Definitions:
Proficient -- The percent of students who are Proficient or Advanced
Growth + Prof Pct -- the percent of students who were Proficient or Advanced plus the percent of students who are on track using the Growth calculation.
Symbols:
* Indicates the subgroup meets the minimum cell size requirements. Minimum cell size requirements: 30 for all subgroups. (for 2004,2005, 2006, and 2007, IEP and LEP subgroups had a minimum cell size of 50.)
^ If there are fewer students in the school total, and the State Proficiency Target was not met, the current and two prior years are aggregated. This applies only to the calculation for the school total, the the disaggregated subgroups.
@ The group Met the 95% participation rate using an average of current and prior year, or current and prior two years.
AYP Met Symbols:
Y - Annual Proficiency Target Met
CI - Annual Proficiency Target Met with confidence interval
G - Annual Proficiency Target Met using Growth
S - Annual Proficiency Target Met using Safe Harbor provision
SC - Annual Proficiency Target Met using the confidence interval for Safe Harbor
AYP NOT MET Symbols
N* - Annual Proficiency Target Met, but did not have a participation rate of at least 95%
NC - Annual Proficiency Target Met with a confidence interval, but did not have a participation rate of at least 95%
NP - Annual Proficiency Target Not Met
NN - Annual Proficiency Target Not Met and the participation rate was less than 95%
Get more local news delivered straight to your inbox. Sign up for free Patch newsletters and alerts.